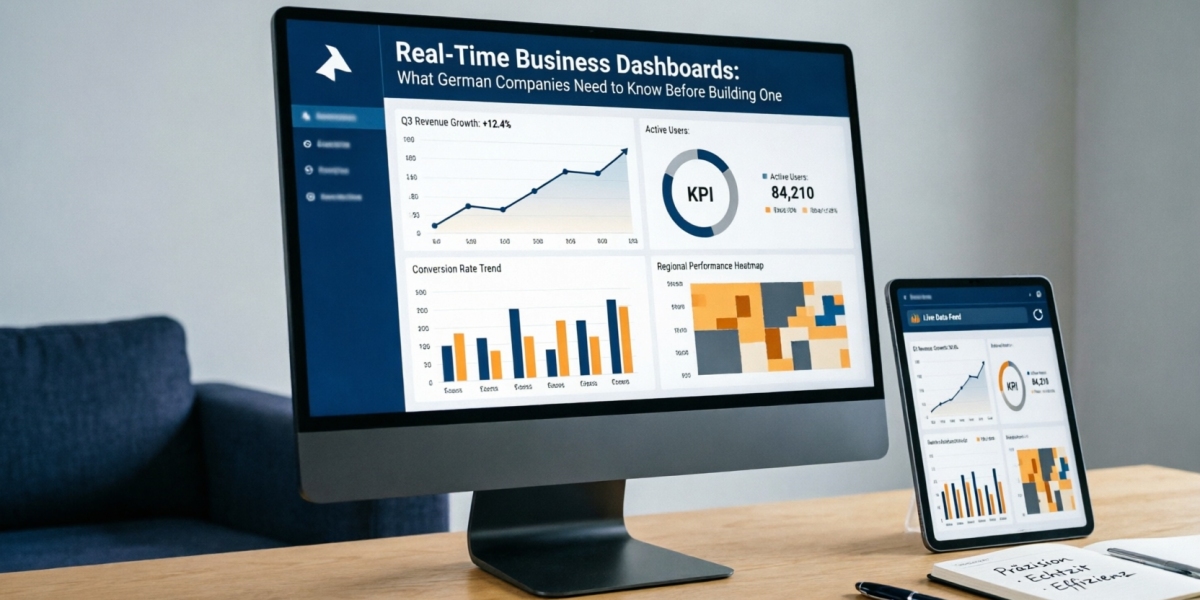

A dashboard that updates itself every few seconds sounds like an obvious improvement over a Monday morning report. Many companies assume this and then learn a few months into the project that the real-time version is much more expensive to run than planned, and that nobody makes better decisions merely with more rapid information flows. Others see that an apparently small change to the refresh frequency transforms a team's working patterns.
The real question is therefore not whether real-time dashboards are worthwhile, but what difference does the timing make to decisions? This article explains what real-time dashboards actually require, when they are worth building and what German companies should consider before getting started.
What "Real-Time" Usually Means
The term encompasses a wide range. Slightly delayed but near-real-time data might appear every few minutes, whereas strictly within a second or two means that messages are being pushed straight from the source to the dashboard. Many business dashboards in use today are in fact not live, but have reports scheduled to refresh every half-hour or even once a day.
It is worth thinking about the difference between a 10-minute and a 2-minute refresh. The former can be implemented in most BI tools using simple scheduled extractions. A dashboard that needs to display sensor values or order events within seconds, though, will usually require messaging infrastructure, stream processing and fault tolerance in the pipeline.
Before deciding on a technology, reach agreement with the dashboard users on what delay they would consider valuable, and what they would actually be able to do with a minute-old value when they know the situation was different an hour ago. If the answer is "nothing", the extra effort is not worth it.
Where Live Data Genuinely Helps
Timeliness creates value when there is an opportunity to act on it.
A logistics team that sees the current whereabouts of vehicles and any delivery delays can reroute or warn customers, potentially avoiding a complaint later. A production supervisor that sees stoppages and actual output by the hour can dispatch maintenance staff during the next shift, as the production plan continues to run. A customer service manager that monitors the length of their ticket queues and average waiting time can move staff between support channels during a peak. An e-commerce team that watches sales and stock levels during a promotion can react to a payment issue or a product's unexpected popularity much faster than after a day's end.
In contrast, management reports on revenue, margin or headcount are usually not acted on within an hour, and the latest numbers may simply trigger unproductive reactions such as trying to explain away hourly random fluctuations. A live dashboard for these is unlikely to be worth building.
The Technical Building Blocks
Even a simple live dashboard consists of several layers, and poor execution at any stage will become visible.
Data sources and capture
Operational systems such as ERP systems, CRM databases, machine controllers or e-commerce platforms are where the data originates. Querying a live database might slow the supporting application, so many companies use change data capture, event streams or replica copies of the database contents instead. The decision here depends heavily on what options are available in the source systems, and older ERP systems in particular can have few ways for extracting data without impact. This is where many projects face their first hurdle.
Processing and storage
The raw events often need to be massaged, matched with additional reference data (what machine, customer or product does this event belong to) and aggregated (how many orders per minute, average waiting time) in order to create a dashboard. This processing also includes handling duplicated or delayed events. Decide at this stage whether historical data is needed for analysis or only the latest value is of interest for monitoring.
Presentation
The dashboard itself should make relevant information obvious, and highlight exceptions. A cluttered or constantly updating screen is tiring to look at. Think about setting thresholds, using colour judiciously and comparison with expectations such as a target. Consider the context in which the dashboard is used: a shop floor display has large simple indicators, and a manager on a laptop may need drill-down.
Data Quality Becomes Visible Immediately
One of the side effects of going live is that poor quality data becomes apparent immediately. In a monthly report, a misplaced order value will be corrected quickly. In a live dashboard, an incorrect value may be visible to many within hours.
Find out how your source systems handle correction, cancellation and delayed orders. Does the warehouse book goods receipt at the end of the shift, as a result of which a live inventory figure will be wrong until it is too late? Sometimes the solution is to change how the data is captured rather than attempt to display it, for instance by recording movements at the time they occur before building an event pipeline. This is a benefit of the project but also a potential reason for increased timeline length.
Make sure there is agreement on terms: if the definition of "order" is different in sales and logistics, the dashboard will indicate this.
Alerts, Not Just Screens
A dashboard only has value if somebody is watching it. For many live data scenarios, an alert is more useful than a screen in the office. When a production machine stops, a payment attempt fails or a delivery driver misses a slot, the relevant person can be notified.
Alert design deserves care. Too many alerts trigger general disregard and lead to an "alert fatigue". Begin with a small set of clearly actionable triggers, specify who acts on them, and review the content after a few weeks to remove any that do not produce useful results.
German Requirements: Data Protection and Employee Data
Live dashboards occasionally feature personal data, such as employee productivity, vehicle locations indicating drivers' whereabouts, call centre statistics or customer behaviour. In Germany this introduces data protection and works council considerations. Monitoring employees in particular involves many factors, and the rules depend on what data is displayed and what agreements exist within the organisation. Involve your data protection officer and legal adviser, and the works council if one exists, before creating employee-facing dashboards.
For customer-related data, the questions are where data is processed and stored, access control measures and contractually agreed responsibilities for processing. If a cloud service is involved, ask for clear written statements on hosting locations and who at the provider may read the data.
Build, Buy or Combine
Standard BI and monitoring platforms support many live dashboard requirements, particularly near-real-time data from commonly used systems. They are the obvious starting point for most companies, reducing implementation effort and providing familiar user interfaces.
Custom development becomes relevant if data arrives in non-standard ways, such as from machines and sensors, if dashboards need to be embedded in another application or customer portal, or if performance and latency requirements are tighter than those platforms can provide. Businesses in northern Germany sometimes engage providers offering Softwareentwicklung in Hamburg for data pipelines related to logistics and port systems, where the time of information is essential. No matter the chosen path, always consider ongoing costs as well as build costs, as streaming data and monitoring infrastructures require attention.
Starting Small and Proving Value
Pick one operation where speed of information is known to be a problem, for instance late deliveries or machine downtime, and build a dashboard that demonstrates improved insights. Agree on success criteria ahead of time, for example reduced escalations or faster problem response based on a benchmark, and run the dashboard in parallel to existing reports for a period to enable comparison and user feedback.
Ensure there is an owner for the dashboard: somebody who maintains the data pipeline, deals with technical problems and handles change requests. Unmaintained dashboards degrade as underlying data sources change.
If your IT department cannot provide the required pipeline and integration work, temporary support from outside through Softwareentwicklung Outsourcing can help, as long as definitions and priorities remain within the business. For a more custom solution, such as a customer portal, teams offering Softwareentwicklung in Berlin are another possibility. Ask potential suppliers for similar examples, and for clarity on documentation and post-launch support.
Conclusion
A real-time dashboard is worth building if there is an opportunity to act on the information at the time, and the underlying data is trustworthy at a glance. In many cases, near-real-time data from existing systems provides most of the value with less investment.
A first step is to compile a list with the three situations in the past year where delayed information has either cost direct money or customer goodwill. For each of these, decide on how quickly someone would need to know about the situation and what they could do about it, and which dashboard would help. This indicates both where real-time dashboards are beneficial and sets priorities for refresh rates.