
Most traders open TradingView, load a popular script, and start trusting its arrows right away. However, that habit causes more losses than any bad market. An algorithmic trading indicator can be a genuinely useful tool. Still, it only helps when you know how to install it, read it, and question it.
Over the years, I have watched traders make the same mistakes again and again. They chase signals they do not understand. They ignore settings. Worst of all, they never check whether the indicator changes its past signals. In this guide, you will learn how to add an algorithmic trading indicator to your TradingView charts, how to read it with confidence, and what to check before you rely on it.
What Is an Algorithmic Trading Indicator?
An algorithmic trading indicator is a script that applies fixed rules to price and volume data. Instead of guessing, it follows a set formula every time. As a result, it removes some of the emotion that clouds manual decisions.
Traditional tools like the RSI or a moving average measure one thing. In contrast, an algorithmic trading indicator often combines several inputs into a single output. For example, it might blend trend direction, momentum, and volatility. Then it shows you a simple buy or sell label, a colored zone, or a trend line.
On TradingView, these tools are written in Pine Script. Some are free and open-source, while others are invite-only. Either way, they sit on top of your chart and update as new candles form.
It is worth stressing one point early. An indicator is a decision-support tool, not a crystal ball. It organizes market data so you can act with more structure. However, it cannot predict news, sudden gaps, or shifts in market sentiment.
How Algorithmic Trading Indicators Work
To use any tool well, you first need to understand how algorithmic trading indicators work behind the scenes. Fortunately, the logic is simpler than most people think. Almost every script follows the same three-stage process.
1. Data input. First, the script reads raw data from each candle. This usually includes the open, high, low, close, and volume. Some scripts also pull data from higher timeframes.
2. Rule processing. Next, the script runs that data through its rules. For instance, it may check whether price closed above a moving average while momentum is rising. It may also filter out signals during low volatility. These conditions act like a checklist that must be met.
3. Signal output. Finally, when every condition is true, the script plots something on your chart. That might be an arrow, a label, a background color, or an alert.
Because the rules never change, the output stays consistent. That consistency is the real value. Moreover, it lets you test the logic on past data and judge it fairly.
Still, knowing how algorithmic trading indicators work also reveals their limits. Every rule is based on past price behavior. Therefore, signals will lag during sharp reversals and struggle in choppy, sideways markets. No formula escapes that trade-off.
Why a Non-Repainting Trading Indicator Matters
Repainting is the single biggest trap in indicator trading. A repainting script changes or removes signals after they appear. Consequently, its history looks almost perfect, yet live results fall apart.
Here is a common example. A buy arrow appears while a candle is still forming. Then price drops before the close, and the arrow quietly disappears. When you scroll back later, you only see the winning signals that survived.
A non-repainting trading indicator works differently. Once a candle closes and a signal prints, that signal stays fixed forever. In other words, what you see on past bars is exactly what you would have seen live.
So how can you check this yourself? Try these simple tests:
- Use Bar Replay. Open TradingView's Bar Replay tool and step forward one candle at a time. Then compare the signals with the full historical view.
- Watch it live. Keep the chart open on a short timeframe for an hour. Note every signal, and later confirm that none have moved or vanished.
- Read the description. Honest developers explain whether signals confirm on candle close. If that detail is missing, treat it as a warning sign.
In my experience, this one check filters out a large share of misleading scripts. Above all, never judge an algorithmic trading indicator by its historical chart until you have confirmed it does not repaint.
How to Add an Algorithmic Trading Indicator on TradingView
Adding a script takes less than two minutes. The steps below work on the web platform, the desktop app, and mostly on mobile too.
- Open your chart. Log in to TradingView and open the symbol you want to trade. Then choose your preferred timeframe.
- Click "Indicators." You will find this button in the top toolbar, marked with an "fx" icon.
- Search for the script. Type the indicator's name into the search bar. Public scripts appear under the Community tab.
- Check invite-only access. If the script is private, the developer must grant access to your username first. After that, it shows up under the "Invite-only scripts" section.
- Click to apply. Select the script once, and it loads straight onto your chart. Some tools appear on the price chart, while others open in a separate pane below.
- Add it to favorites. Click the star icon next to the name. As a result, you can load it in one click next time.
Once the tool is on your chart, do not start trading immediately. Instead, take a few minutes to open its settings and understand what each input controls.
How to Read an Algorithmic Trading Indicator on Your Charts
Reading signals well is a skill, and it improves with practice. Most scripts share a few visual elements, so let's break them down.
Buy and Sell Labels
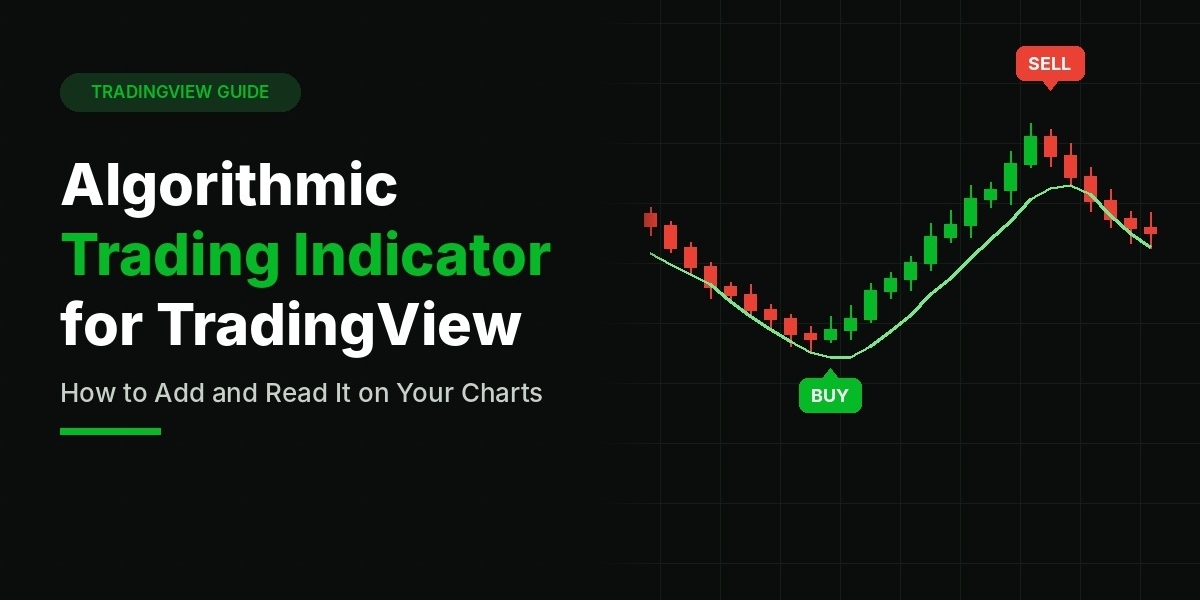
Arrows or labels mark the exact candle where all conditions were met. A buy label below a candle suggests bullish conditions. Similarly, a sell label above a candle points to bearish conditions. Remember, though, that a label is a prompt to analyze, not an order to click.
Trend Colors and Zones
Many tools color the candles or background. Green usually signals an uptrend, while red signals a downtrend. Grey or neutral colors often mean the market lacks direction. In those periods, it is wise to trade less or not at all.
Support, Resistance, and Targets
Some scripts plot entry levels, stop-loss lines, and take-profit targets. These levels give useful structure. Even so, always compare them with nearby support and resistance on the chart.
Confirm With Context
The best traders never read a signal in isolation. Before acting, ask three quick questions:
- Does the higher timeframe trend agree with the signal?
- Is price near a major level that could block the move?
- Is there a big news event coming up soon?
If two of those answers work against the trade, it is usually better to wait. After all, patience costs nothing, while forced trades often do.
Adjusting Settings and Testing Before You Trade
Default settings are rarely ideal for every market. For that reason, a short setup routine pays off quickly.
Match the timeframe to your style. Scalpers often use 1 to 5-minute charts. Swing traders, on the other hand, prefer 4-hour or daily charts. Higher timeframes usually produce fewer but cleaner signals.
Tune sensitivity carefully. Many scripts include a sensitivity or period input. A lower value creates more signals but also more noise. Meanwhile, a higher value gives fewer signals with more lag. Change one input at a time so you can see its real effect.
Set alerts. TradingView lets you create alerts from most indicators. Right-click the chart, choose "Add alert," and select your script as the condition. This way, you do not need to watch the screen all day.
Backtest and forward test. First, scroll through past data and record how signals performed. Then, paper trade for at least a few weeks. Forward testing matters most because it shows how a non-repainting trading indicator behaves in real time, with real spreads and real emotions.
Common Mistakes to Avoid
Even a well-built algorithmic trading indicator cannot protect you from poor habits. These are the errors I see most often:
- Stacking too many indicators. Five tools that measure the same thing do not add confirmation. Instead, they add confusion. Two or three complementary tools are usually enough.
- Ignoring risk management. Every trade needs a stop-loss. Most professionals risk only 1 to 2 percent of their account per trade.
- Trusting perfect backtests. If past results look flawless, check for repainting first. Real trading always includes losing streaks.
- Switching tools too fast. Many traders drop a script after three losses. However, no system can be judged on a handful of trades.
- Trading every signal. Signals in quiet, sideways markets often fail. Hence, being selective is a strength, not a weakness.
Above all, keep a trading journal. Record each signal, your reasoning, and the result. Over time, this record will show you exactly where your algorithmic trading indicator performs best.
Final Thoughts
An algorithmic trading indicator can bring structure, speed, and consistency to your TradingView charts. Yet its value depends on how you use it. First, understand how algorithmic trading indicators work so you know their strengths and limits. Next, confirm you are using a non-repainting trading indicator, and test it patiently before risking real money. Finally, read every signal alongside trend, key levels, and sound risk management.
Many traders researching this topic come across tools such as GainzAlgo and naturally ask, "is GainzAlgo legit?" The fairest way to answer that question, for any indicator, is to apply the same checks covered in this guide. Run it through Bar Replay, watch it live, review whether signals confirm on candle close, and forward test it on a demo account. In the end, your own documented results will tell you far more than any marketing claim or online review ever could.